Anomalous refraction was first observed with the 30-m telescope (Altenhoff et al. [1987]). It was observed to occasionally move the source images by a large fraction of the beam width. It is well recognized that it is due to the same random fluctuations of the atmospheric water content, constantly observed by millimeter interferometers, which would limit the angular resolution of our synthesis maps to about one arc second on average nights, without the help of the radiometric phase correction. In that case the term `seeing' seems more appropriate, in relation with optical astronomy. These random fluctuations persist on the scale of a single dish; a linear variation in the water content across the telescope aperture causes a linear phase gradient and thus a deviation of the beam.
The atmospheric rms phase fluctuation ![]() in an
interferometric observation is generally related to the baseline
length b
by a relation of the form
in an
interferometric observation is generally related to the baseline
length b
by a relation of the form
![]() (Olmi and Downes [1992]).
The power law exponent
(Olmi and Downes [1992]).
The power law exponent ![]() is in the range 0.4-0.8.
If one extrapolates this relation to scales smaller than the antenna size,
one may predict the amplitude of the random pointing deviations (seeing) caused
by these phase fluctuations:
is in the range 0.4-0.8.
If one extrapolates this relation to scales smaller than the antenna size,
one may predict the amplitude of the random pointing deviations (seeing) caused
by these phase fluctuations:
![]()
This formula should actually only be valid for azimuth deviations;
for elevation a more appropriate formula at elevation ![]() should be
should be
![]()
since the antenna beam intercepts an ellipse of axes D and ![]() in each layer of the atmosphere.
in each layer of the atmosphere.
For the above pointing data the information on phase fluctuations is
available on six baselines in the range 24 to 64 m. I have assumed an
index ![]() and extrapolated the phase data down to 15-m scale to
compute the seeing parameters
and extrapolated the phase data down to 15-m scale to
compute the seeing parameters ![]() and
and ![]() . The
observed pointing errors are plotted as a function of these parameters
in Fig. 7. The pointing errors averaged on all
antennas are also shown in Fig. 8.
. The
observed pointing errors are plotted as a function of these parameters
in Fig. 7. The pointing errors averaged on all
antennas are also shown in Fig. 8.
It is clear that the observed pointing
errors are well correlated
with atmospheric seeing; however, as can be shown by averaging
the data of the three points with highest fluctuations, the above
method must be overestimating the seeing by about ![]() . This is most
probably due to different sampling times in the pointing measurements
and the phase measurements. The individual pointing scans were
separated by longer time intervals than the typical integration time
of phase measurements (actually estimated from the pointing scans
themselves). One should ideally do more frequent pointing scans, and
interrupt them from time to time to perform longer on-source integrations,
suitable to sample the temporal structure function of the phase
fluctuations. The seeing parameter could have also been overestimated if the
exponent
. This is most
probably due to different sampling times in the pointing measurements
and the phase measurements. The individual pointing scans were
separated by longer time intervals than the typical integration time
of phase measurements (actually estimated from the pointing scans
themselves). One should ideally do more frequent pointing scans, and
interrupt them from time to time to perform longer on-source integrations,
suitable to sample the temporal structure function of the phase
fluctuations. The seeing parameter could have also been overestimated if the
exponent ![]() was systematically higher for scales lower than 24m.
was systematically higher for scales lower than 24m.
On the other hand, the points with lowest fluctuations in Fig. 8 do lie above the straight line; this could be due to overestimation of the pointing error r.m.s. (at this level the measurement error may contribute to the statistics). However measured tracking errors are in the 0.2-0.5'' range and must contribute to the observed r.m.s.
In a recent memo Holdaway ([1997]) computed the expected pointing degradation due to seeing on the Chajnantor site. He found that r.m.s. deviations of 0.5'' should be expected about half of the time.
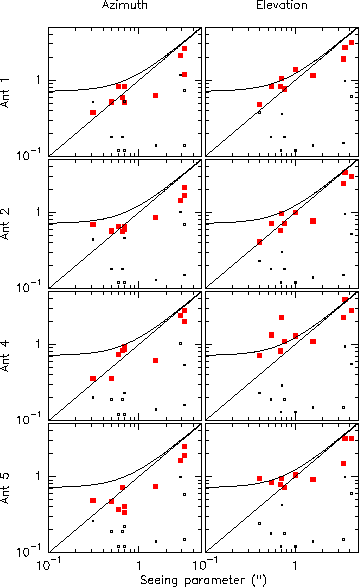
Figure 7: Correlation of observed pointing errors with the seeing parameter.
The big squares are the observed pointing r.m.s. deviations in arc seconds;
the small squares indicate the measurement r.m.s. errors. The curved lines
represents ![]() where s is the seeing parameter
where s is the seeing parameter
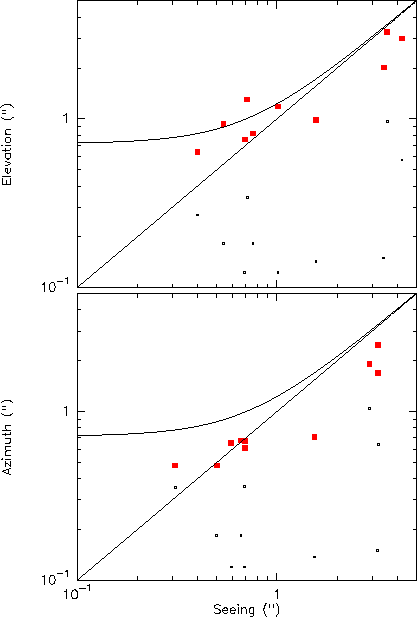
Figure: Correlation of observed pointing errors with the seeing parameter: same as
Fig. 7, for the
average of the four available antennas