Back to Memolist
MMA Memo 186: Calculation of Anomalous Refraction on Chajnantor
M.A. Holdaway
National Radio Astronomy Observatory
949 N. Cherry Ave.
Tucson, AZ 85721-0655
email: mholdawa@nrao.edu
September 30, 1997
Abstract:
We have investigated the effects of inhomogeneously
distributed water vapor, as characterized by our 11.2 GHz site testing
interferometer database, upon antenna pointing. This effect, known as
``anomalous refraction'', has been seen at poorer sites with
millimeter wavelength telescopes for years (Altenhoff et al.
1987). Because of the structure of atmospheric turbulence, the
pointing error in arcseconds will be smaller for larger antennas, but
the pointing error will be larger in terms of the fraction of the beam
size. The time scale of the pointing error will be nearly the time
required for the atmosphere to cross the dish. To first order, water
vapor is non-dispersive, so the anomalous refraction pointing errors
will be independent of frequency. However, there is mild dispersion
in the submillimeter, resulting in slightly larger pointing errors in
the submillimeter windows. For an 8 m dish on the Chajnantor site,
the atmospheric contribution to the pointing errors will usually be
well under an arcsecond, except during poor weather and while
observing at the lowest elevation angles.
Recently, there has been some concern over the stringent 1 arcsec
pointing error requirement on the MMA antennas. While the pointing
requirement is one of the main drivers for the antennas, it is clear
that we need the good pointing to make high quality mosaic images at
millimeter and submillimeter wavelengths. Some investigators have
questioned if 1 arcsec pointing can even be useful at all, given that
the turbulent atmosphere causes both the synthesized beam and the
primary beam to dance about the sky. If the columns of water vapor
above two antennas are different, a phase error will result,
effectively causing that baseline's contribution to the synthesized
beam to shift on the sky. If there is a gradient in the water vapor
distribution above one antenna, anomalous refraction, or a shift in
the apparent pointing, will result (see Figure 1). Since
both effects are caused by inhomogeneously distributed water vapor, we
can predict the magnitude of these effects from the site testing
interferometer data (Holdaway et al., 1995). Simulations of
mosaicing with phase errors appropriate to the Chajnantor site have
been found to have little effect on imaging, which is dominated by the
physical pointing errors of the antennas (Holdaway, 1997). Here, we
investigate the severity of the pointing errors caused by anomalous
refraction.
Anomalous refraction (Altenhoff et al., 1987) has been seen with
several millimeter wavelength telescopes. If a wedge of water vapor
falls across the antenna's line of site, refraction occurs. There is
nothing special about these wedges, they are just part of the
distribution of turbulent water vapor, and as such go back and forth
very quickly, as opposed to a systematic, persistent wedge. Hence,
anomalous refraction causes pointing errors with time scale
approximately equal to the time it takes the atmosphere to cross the
antenna. Indeed, some of the early investigations of anomalous
refraction found that the pointing error reversed itself before the
dish could scan over a bright quasar, producing an apparent double
beam.
We approximate the instantaneous phase screen as a wedge. Figure 2
shows an example of an actual phase time series which, assuming
frozen turbulence, has been converted into a one dimensional slice through
a spatial phase screen. The phase bump directly over the antenna
is assumed to be a wedge, and smaller scale deviations from the wedge
will participate in Ruze scattering, making the beam wider.
In Figure 3 we work through the mathematics of the model
for zenith observations. The geometry of our wedge of water vapor
is set by the angle  , which can be related to the
dish diameter d and the path length
structure function
  through:

where n is the index of refraction. Snell's law relates the angle
 between the incident ray and the line perpendicular to the
wedge to the angle
  between the refracted ray and the normal:

The pointing error due to anomalous refraction  is given by

Then, using small angle approximations,

The path length structure function is typically approximated as a power
law in the baseline (here d), but the amplitude and power law
exponent change with the atmospheric conditions:

On the Chajnantor site, the median structure function power law exponent is
1.2 (or the rms path length,  , varies as
  .
Hence, as the dish size increases, the amount of anomalous refraction
actually decreases as
  . However, the anomalous refraction does
not decrease as fast as the beam size, so the pointing error as a fraction
of the beam will increase as
  .
.
Now, the zenith case is the best case with the least amount of
anomalous refraction. We also consider worse cases, with
arbitrary observing elevation and the wedge in the plane
of the line of sight (see Figure 4). We spare the
reader the mathematical details, but point out a few of the
complicating factors:
- the effective baseline at which the path length structure function
must be evaluated is
 , where
  is the observing
elevation angle.
- the structure function depends upon elevation as
 (ie, Holdaway and Ishiguro, 1995).
- small angle approximations cannot be used, except for
 .
.
A person adept in trigo-algebraic manipulations might have gotten the
expression in a nicer form, but the computer doesn't mind that the
expression for the anomalous refraction pointing error for non-zenith
observations is given by

with  now related to the structure function via

Equation 12 reproduces the results of
Equation 9 at the zenith.
From our site testing efforts on Chajnantor, we have a good
statistical knowledge of the path length structure function. Even
though we measure the interferometric phase on a 300 m baseline, we
sample the phase with 1 s integrations. The temporal fluctuations on
1 s timescales are interpreted to be spatial structure flowing over
the interferometer. The signal to noise on 1 s is not always
sufficient to characterize the spatial fluctuations on size scales of
 , but when there is high enough SNR, we find that the
temporal structure function is always well fit by a power law. Hence,
low SNR conditions still permit a fit to the higher SNR medium to long
time scale fluctuations and extrapolation back to the short time
scales we are interested in here. A comparison between the temporal
structure function and the single point we measure on the spatial
structure function at 300 m effectively permits us to solve for the
velocity, or to convert the temporal structure function into the
spatial structure function, which is the required quantity for this
analysis.
We have calculated the rms pointing error due to anomalous refraction
on the Chajnantor site for the three quartiles of the rms path length
fluctuations, for a range of elevation angles, and for dish diameters
8 m, 12 m, 15 m, and 50 m. The three smaller dish diameters are under
discussion for building on the Chajnantor site, and the 50 m
calculations are for the benefit of the LMT project. In
Table 1 we present the results for the pointing error in
arcseconds, along with the fraction of the pointing specification in
parentheses. The pointing specification is taken to be  at 300 GHz for the three smaller dishes (1 arcs, 0.67 arcs, and
0.53 arcs respectively) and 0.6 arcs over 2 hours
for the 50 m dish. If the LMT's
site has worse phase stability than the Chajnantor site, then the
pointing errors due to anomalous refraction will be larger than the
values quoted here.
Also presented in Table 1 are the quartile rms atmospheric
path length differences across the dish, in microns. These numbers
can get quite large, 50-100 microns for the 50 m dish. As stated
earlier, the wedge shape (ie, tilt) will dominate, but there is also
structure on the smaller scales deviating from the wedge. These
smaller scale deviations will behave as surface errors, effectively
broadening the primary beam. Since physical surface errors on the
antenna affect the path length twice (pre and post main reflector) and
these atmospheric fluctuations only affect the path length once
(except for the presumably rare case where the turbulent water vapor
is dominated by thin layer between the main reflector and the
subreflector!) the residual path length deviations must be divided
by two before applying the Ruze formula. We have not investigated this
effect further, as we expect it to usually be small for the small
interferometric dishes.
|
d = 8m, (pointing spec = 1.0 arcs) |
|
| | elevation |
| Q |  , [ , [ ] ] |  |  |  |  |  |
|
25% | 8.8 | 0.22 | 0.31 | 0.52 | 0.81 | 1.73 |
|
| | (0.22) | (0.31) | (0.52) | (0.81) | (1.73) |
|
50% | 18.0 | 0.47 | 0.64 | 1.07 | 1.65 | 3.55 |
|
| | (0.47) | (0.64) | (1.07) | (1.65) | (3.55) |
|
75% | 39.2 | 1.01 | 1.40 | 2.31 | 3.59 | 7.75 |
|
| | (1.01) | (1.40) | (2.31) | (3.59) | (7.75) |
| d = 12m, (pointing spec = 0.67 arcs) |
|
| | elevation |
|
Q |  , [ , [ ] ] |  |  |  |  |  |
| 25% | 11.2 | 0.20 | 0.26 | 0.44 | 0.68 | 1.47 |
|
| | (0.29) | (0.39) | (0.66) | (1.00) | (2.20) |
|
50% | 22.9 | 0.39 | 0.55 | 0.90 | 1.40 | 3.02 |
|
| | (0.58) | (0.81) | (1.40) | (2.11) | (4.50) |
|
75% | 50.0 | 0.86 | 1.20 | 1.98 | 3.05 | 6.59 |
|
| | (1.30) | (1.79) | (3.00) | (4.60) | (9.91) |
| d = 15m, (pointing spec = 0.53 arcs) |
|
| | elevation |
|
Q |  , [ , [ ] ] |  |  |  |  |  |
| 25% | 12.8 | 0.17 | 0.25 | 0.40 | 0.62 | 1.34 |
|
| | (0.31) | (0.47) | (0.75) | (1.17) | (2.51) |
|
50% | 26.2 | 0.36 | 0.49 | 0.82 | 1.27 | 2.76 |
|
| | (0.68) | (0.92) | (1.53) | (2.39) | (5.16) |
|
75% | 57.2 | 0.78 | 1.09 | 1.81 | 2.79 | 6.02 |
|
| | (1.46) | (2.05) | (3.39) | (5.24) | (11.3) |
| d = 50m, (pointing spec = 0.6 arcs) |
|
| | elevation |
|
Q |  [ [ ] ] |  |  |  |  |  |
| 25% | 26.3 | 0.10 | 0.16 | 0.25 | 0.39 | 0.83 |
|
| | (0.17) | (0.26) | (0.41) | (0.65) | (1.20) |
|
50% | 53.9 | 0.22 | 0.31 | 0.51 | 0.79 | 1.70 |
|
| | (0.37) | (0.52) | (0.85) | (1.32) | (2.84) |
|
75% | 118. | 0.48 | 0.68 | 1.12 | 1.73 | 3.72 |
|
| | (0.80) | (1.12) | (1.86) | (2.88) | (6.20) |
Table 1: Calculated pointing error due to anomalous refraction on the
Chajnantor site for different elevation angles, atmospheric conditions,
and antenna sizes. Numbers with no parentheses are in arcseconds,
numbers in parentheses are the fraction of the pointing specification.
We have assumed that the water vapor is non-dispersive, or that
the anomalous refraction is independent of frequency. This is
nearly true up to 300 Ghz, but begins to break down above 300 GHz,
and the pointing errors due to anomalous refraction will be about
30% larger in the submillimeter windows due to large values of the
index of refraction of water vapor.
To first order, the time scale of the anomalous refraction pointing
errors will be the time it takes the atmosphere to cross the dish,
which is on the order of a second. The details of the structure of
the atmosphere will increase the pointing error time scale, especially
for small dishes. We can calculate the time scale of the pointing
errors using the raw phase monitor data. The pointing errors are
proportional to the spatial derivative of the phase screen evaluated
on spatial scales of the dish diameter. The pointing error time
scale can be estimated from these time series (see Figure 5
and Table 2.
These pointing errors will be more or less random over the array.
For observations which are long compared to the
pointing error time scale, the pointing errors will have a minimal
effect, as they are both random in time and with antenna. For
observations which are short compared to the pointing error time scale,
as for On-The-Fly mosaicing or total power work,
the pointing errors will be more problematic. Finally, for a large
single dish performing On-The-Fly imaging, the pointing errors are
most damaging, as they persist over several beams on the sky, but
not long enough to be calibrated, and there are no other antennas
to average down spatially random pointing errors with.
|
Antenna Diameter | Average Pointing |
|
[m] | Time Scale [s] |
| 10 | 2.7 |
|
20 | 3.9 |
|
30 | 5.0 |
|
50 | 6.7 |
Table 2: Anomalous refraction
pointing error time scale as a function of dish diameter.
For arrays of small antennas on a good site, there is little point to
correcting the anomalous refraction. However, for a single large
antenna, pointing errors caused by anomalous refraction may limit the
performance of the antenna some of the time. If one could measure the
distribution of water vapor above the antenna on second time scales,
one could correct for the pointing in real time or in data
post-processing One could do this by mounting four or five 22 GHz or
183 GHz (depending upon the quality of the site) water vapor
spectrometers of the sort David Woody is making, at the edge of the
large single dish, and possibly one on the back of the subreflector.
Altenhoff, W.J., et al., 1987, ``Observations of anomalous refraction at radio wavelengths'', A&A 184, 381.
Holdaway, M.A., and Ishiguro, M., 1995, MMA Memo 127,
``Experimental Determination of the Dependence of Tropospheric
Path Length Variation on Airmass''.
Holdaway, M.A. et al., 1995, MMA Memo 129,
``Data Processing for Site Test Interferometers''.
Holdaway, M.A. et al., 1997, MMA Memo 178,
``Effects of Pointing Errors on Mosaic Images with 8m,
12m, and 15m Dishes''.
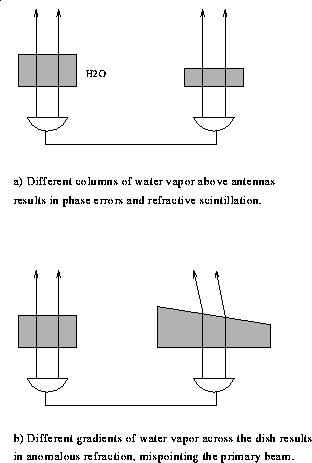
Figure 1: Water vapor distributions resulting in phase errors
and anomalous refraction.
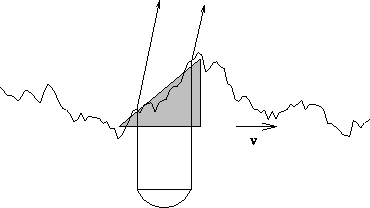
Figure 2: An example water vapor column screen derived from
phase monitor time series data, showing the wedge approximation.
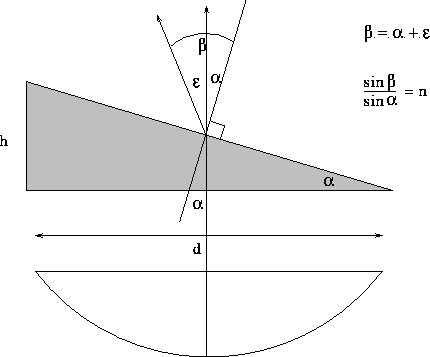
Figure 3: Geometry for the anomalous refraction calculation for the zenith.
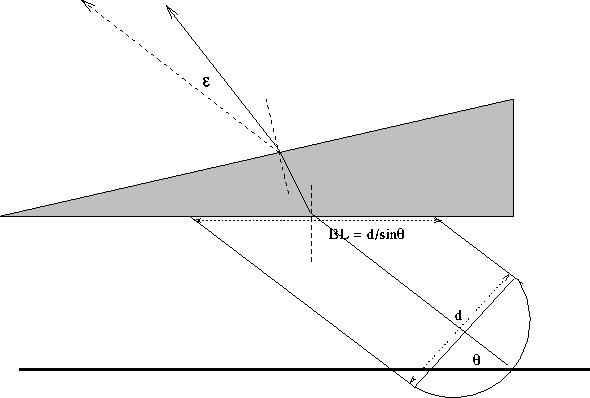
Figure 4: Geometry for the anomalous refraction calculation away from the zenith.
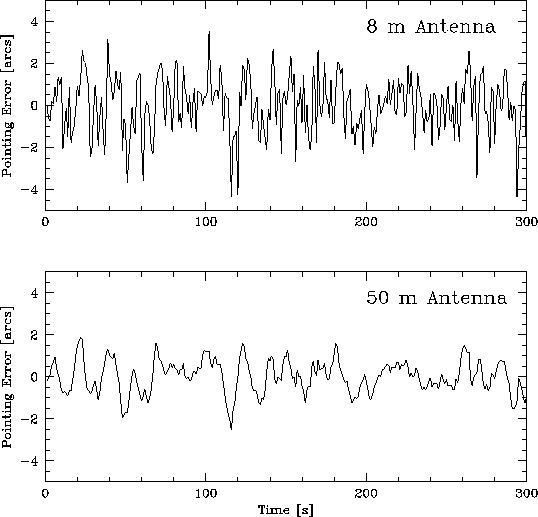
Figure 5: A time series of pointing errors as calculated for an 8 m and
a 50 m dish from site testing data during poor conditions.
The larger dish has smaller pointing errors in arcseconds
(larger as a fraction of the beam), but the time scale of the
fluctuations are larger, and therefore more damaging to
mapping work.


