M.A. Holdaway
National Radio Astronomy Observatory
949 N. Cherry Ave.
Tucson, AZ 85721-0655
email: mholdawa@nrao.edu
Aug 7, 1997
To better understand the tradeoffs involved in the various LSA-MMA collaborative arrays under discussion, we have revisited the effects of pointing errors on mosaic images. First, we investigate the relative impact of various types of systematic and random pointing errors on imaging, and find that systematic errors are 4-10 times more detrimental than random errors. We also investigated a simple pointing self-calibration algorithm that solves for an array-wide pointing error as a function of time, but it fails unless a bright compact source is in the field.
However, one can argue that the systematic pointing errors should be calibrated out for the MMA. For the purposes of mosaicing, pointing drifts which are linear in time and the same for all antennas (such as may be induced by thermal effects) can be back-interpolated during post processing to determine the actual mean pointing position of the array. The pointing errors are then dominated by wind-induced pointing errors, which are assumed to be highly time variable but systematic across the array, and random residuals from the removed pointing drift. Using this new pointing error model, we investigate the effects of pointing errors on mosaic imaging with arrays of 40 8 m antennas with 1 arcsecond errors, 27 12 m antennas and 60 12 m antennas with 1 arcsecond errors, and 35 15 m antennas with 1.5 arcsecond errors. We find that the 8 m antennas mosaic pretty well even into the submillimeter, the 12 m antennas don't do as well and begin to fail in the submillimeter, and the 15 m antennas do a poor job mosaicing even at frequencies as low as 230 GHz. With our pointing error model, which is dominated by wind-induced errors assumed to be the same for each antenna, there is little difference between the imaging quality of an array of 27 antennas and 60 antennas. Adding typical phase errors to the observations does not change the results as the imaging is limited by pointing errors.
On June 25 and 26 of 1997, European representatives of the LSA project met with representatives of the MMA project to discuss the possibility of building a single collaborative array. In addition to a resolution which stated the goal of working towards a single array, we also agreed to study two different array design concepts: a homogeneous array with 50-60 12 m antennas pointing to 1 arcsecond rms, and a heterogeneous array consisting of both 40 8 m antennas pointing to 1 arcsecond and 25-35 15 m antennas pointing to 1.5 arcsecond. One of the central questions in deciding which collaborative array concept to proceed with is how well the various options will mosaic.
Mosaicing capability will be very important for any millimeter wavelength telescope because the primary beam will generally be smaller than the size of many of the telescope's targets. The primary beam will be about
![]()
and objects larger than this size will require mosaicing. Most nearby
galaxies and many objects in our own Galaxy will be larger than
![]() '' , and will therefore require mosaicing.
'' , and will therefore require mosaicing.
There are various ad hoc requirements for antenna pointing and surface accuracy for the highest observing frequency for generic single pointing interferometry at; typically, pointing must be 1/10 of a beam width or better, and surface errors must be 1/16 of a wavelength or better. These requirements are generally based on sensitivity arguments, and if one is willing to put up with poorer sensitivity, these requirements can be relaxed somewhat. Cornwell (1988) and Cornwell, Holdaway, and Uson (1993; hereafter CHU) point out that mosaicing requires much more stringent pointing and surface specifications to obtain good image quality, as there is generally a lot of emission far out in the primary beam where the beam pattern is changing very quickly with position, and any pointing errors or unmodeled beam-shape errors will cause the visibilities to mis-measure the flux; when two different visibilities disagree on how much flux belongs to a feature, they split the difference and scatter flux in the reconstructed image. CHU predict that image quality will be inversely proportional to the rms pointing error as a fraction of a beam. However, this semi-analytical approach cannot address the complex nature of pointing errors, which will have both systematic and random components, so CHU also presented a set of simulated MMA mosaic observations for a range of pointing errors, which verified the general shape of the semi-analytical result.
Our understanding of the antenna and its wind-induced and thermal-induced pointing errors has improved a lot in the last few years. Also, the MMA's highest expected frequency has jumped from 345 GHz to 850 GHz, further straining the MMA pointing specification. And finally, there is considerable pressure among various factions both within and outside the US to push the MMA antennas towards larger dish diameter to improve sensitivity, even at the peril of mosaicing capability. Hence, it is time to revisit the effects of pointing errors on mosaic images for the MMA.
In this memo, we investigate the mosaic image quality which is possible with homogeneous arrays with 8 m, 12 m, and 15 m dishes. In addition to the homogeneous arrays, we would also like to know how well the heterogeneous array with both 8 m and 15 m dishes will mosaic. We have demonstrated in MMA Memo 177 (Holdaway, 1997a) that the existing non-linear mosaicing algorithm can make good images from heterogeneous array data, including visibilities which cross-correlate antennas with different dish diameters. However, the software for simulating pointing errors with two different voltage patterns on a given baseline has not yet been implemented, so the full heterogeneous array mosaicing comparison cannot be done at this time. However, we can infer something of the quality of mosaics made by an array with 8 m and 15 m dishes based upon our 15 m dish simulations presented here.
CHU used a pointing error model with approximately equal contributions from systematic and random pointing errors, but never investigated the effects of the systematic or random pointing errors alone. For this work, we look at each of the four types of pointing error included in the CHU pointing model: global pointing errors, which are common to all antennas and are time independent in the AZ-EL frame; drift pointing errors, which are common to all antennas but drift linearly with time in the AZ-EL frame; random 1 pointing errors, which are random among antennas, but are time independent in the AZ-EL frame, and random 2 pointing errors, which are random among antennas and change randomly with each integration as well. Table 1 shows the dynamic range and image fidelity for each of these types of pointing errors for an example simulation of a 25 pointing mosaic at 345 GHz with 2 arcsecond pointing errors and 8 m antennas.
| Pointing | Dynamic | Median |
| Error | Range | Fidelity |
| Type | ||
| Global | 83 | 8.05 |
| Drift | 149 | 12.88 |
| Random 1 | 398 | 24.72 |
| Random 2 | 805 | 37.39 |
From these results, we see that the systematic global type pointing errors have an impact on mosaic image quality which is 4-10 times worse than the impact of purely random pointing errors. Clearly, the details of the pointing error model used in our mosaicing simulations is very important, and a new model with a more realistic treatment of systematic pointing errors must be developed.
Since pointing errors which are common to all antennas are the most damaging sort of pointing error, there is some hope that we can overcome their effects. If these systematic pointing errors are constant in time, they can be corrected for via standard pointing calibration. If there is a linear drift in the systematic pointing error with time, we will be able to interpolate the pointing values between standard pointing calibrations and perform the mosaicing with the more correct pointing positions. And if there are array-wide pointing errors which vary quickly with time in a more complicated manner, we may still be able to perform pointing self-calibration to solve for these errors.
The general case of solving for antenna-dependent, time-dependent pointing errors will be very costly in cpu time, and the subsequent task of forming a mosaic image from the data and the determined pointing errors will be equally demanding. However, performing a limited pointing self-calibration which solves only for the systematic pointing error at each solution interval will be fairly cheap, and forming a mosaic image considering the corrected pointing positions will only increase the computational requirements by a factor equal to the number of independent solution intervals per mosaic pointing.
We have performed some preliminary work on this simple approach to pointing self-calibration. For a complicated object which fills the beam, one probably cannot determine the pointing errors from the visibilities, but must work in the image plane. The pointing errors must then be determined by comparing an estimate of the true sky brightness distribution (ie, the mosaic image obtained from all of the pointings, as each feature in the image will be close to some pointing center) after the primary beam has been applied at the supposed pointing position, and the individual pointings' images. The differences in these images, especially at the individual pointing's primary beam's edges, will provide the information required to solve for a systematic pointing error. However, the mosaic image will include all spatial frequencies, while the single pointing will have only the high spatial frequencies. Hence, a limitation on the success of this type of pointing self-calibration will be the ability to make a good, high SNR image using just the high spatial frequencies. In other words, if there is a ``bright'' point source in the field, pointing self-calibration will work fine. If, on the other hand, the structure is more ``woofly'' with structure on all spatial scales, restricting the imaging to the high spatial frequencies will result in image artifacts which will limit the accuracy of the pointing estimation. This pointing self-calibration algorithm will be discussed more quantitatively in a future MMA Memo.
In most cases, thermal effects will result in pointing errors which vary slowly and smoothly with time. If uncorrected, the thermal-induced pointing errors would probably fall between the global and the drift type pointing errors, about as severe as they come. However, the antenna group has estimated that pointing calibration once every 30-60 minutes should keep the thermal-induced pointing errors below 1 arcsecond at all times except perhaps during the times when the temperature is changing most rapidly around sunrise and sunset. If the thermal-induced pointing errors are dominated by a linear drift which is similar for all antennas, we can interpolate the pointing solutions in time and use the corrected array pointing positions at the imaging stage. Finally, the most demanding mosaics will be performed at night when both thermal gradients and wind speeds are at a minimum. At this point, we can dismiss thermal-induced pointing errors as well behaved and easily treatable, and we turn our attention to wind-induced pointing errors.
In MMA Memo 159, Holdaway et al. (1996) calculated the effects
of typical wind fluctuations at the Chajnantor site on antenna
pointing, assuming that the wind-induced and random pointing errors
are given by
![]()
where ![]() is a reference wind velocity (9 m/s) at which
dynamical antenna simulations have been carried out, and
is a reference wind velocity (9 m/s) at which
dynamical antenna simulations have been carried out, and
![]() is the typical pointing error at
is the typical pointing error at ![]() = 9 m/s
as determined by the dynamical antenna simulations (3.5 arcseconds).
In addition to the wind-induced pointing error, there is a random
pointing error of about due to the general flopiness of
the antenna. These two terms add in quadrature in the formal
calculation of an rms pointing error, but the wind-induced term will
be largely systematic among the antennas (but highly time-variable)
and hence much more damaging to the imaging than the random component
will be1.
Analyzing the wind fluctuation data in this way, Holdaway et al.
(1996) found that the residual wind-induced pointing errors after
frequent pointing calibration (ie, once every 10-20 minutes) could be
reduced to about 0.25 - 0.5 of the ``blind'' (ie, without pointing
calibration to account for the wind) pointing values.
= 9 m/s
as determined by the dynamical antenna simulations (3.5 arcseconds).
In addition to the wind-induced pointing error, there is a random
pointing error of about due to the general flopiness of
the antenna. These two terms add in quadrature in the formal
calculation of an rms pointing error, but the wind-induced term will
be largely systematic among the antennas (but highly time-variable)
and hence much more damaging to the imaging than the random component
will be1.
Analyzing the wind fluctuation data in this way, Holdaway et al.
(1996) found that the residual wind-induced pointing errors after
frequent pointing calibration (ie, once every 10-20 minutes) could be
reduced to about 0.25 - 0.5 of the ``blind'' (ie, without pointing
calibration to account for the wind) pointing values.
In the present work, we perform mosaic simulations with wind-induced pointing errors as calculated from Equation 2 and typical wind speed and direction time series. The one hour wind time series was chosen to have an average wind speed of 8 m/s (the median daytime wind speed; night time winds are less severe), and to have an inferred rms pointing error after half hour pointing calibration which was typical of other one hour wind time series with average wind speed between 7.5 and 8.5 m/s. The wind speed and direction time series are shown in Figure 1.
We assumed the wind velocity rotated the antenna's dish in the direction of the wind, and this antenna motion is then converted into azimuth and elevation pointing errors, which are shown in Figure 2 a. We then assumed that the initial wind-induced pointing was calibrated via a standard 5 point observation over the first 60 s of the wind time series. The resulting residual wind-induced pointing errors are about 0.8~arcseconds for our median day time wind time series, and are shown in Figure 2 b. The character of these rapidly fluctuation pointing errors, assuming they are the same for all antennas at any given time, is not as severe as the drift pointing errors, and perhaps a bit more severe than the random 1 pointing errors (in which all antennas had different constant errors) for mosaics in which each pointing is observed once, and probably less severe than random 1 pointing errors if each pointing is observed multiple times.
We have performed simulated mosaic observations with compact arrays with 1.28 D minimum antenna separations representing portions of the LSA/MMA collaboration possibilities:
The details of the simulation results will depend upon the model source used, and it is our plan to perform more simulations on different sources in the future.
The pointing error model included three components:
The simulated mosaic data was imaged using the non-linear mosaic algorithm in SDE (ie, Cornwell, 1988; Cornwell, Holdaway, and Uson, 1993) run out to 70 iterations to ensure that the images were not limited by convergence problems. (Between 30 and 70 iterations, the fit improved by only a few percent.)
Image quality was gauged by the
Plots of the dynamic range, the median fidelity, and the first moment fidelity, as a function of frequency for the 40 8 m, the 60 12 m, and the 35 15 m arrays are shown in Figures 3, 4, and 5 respectively. The arrays with 8 m antennas are able to achieve much higher dynamic range mosaics in these simulations than the arrays with 12 m or 15 m dishes. In dynamic range, there is little difference between the 12 m and 15 m cases, in spite of the larger pointing error of the 15 m dishes. The median fidelity shows the three different dish diameters separating out nicely, with 8 m about 50% better than the 12 m, and 12 m more than twice as good as the 15 m, roughly as we might expect if the image quality is inversely proportional to the pointing error as a fraction of the primary beam. The first moment fidelity indicates the 12 m array performs somewhat closer to the 8 m array, and the 15 m array performs very poorly.
We do not include results from the 27 12 m array, as these simulations produced dynamic ranges and fidelities which were within 10% of the 60 12 m array. The similarity in the results can be understood once one remembers that the image quality is dominated by the wind pointing errors, which is assumed to be the same for all antennas for a given time. Hence, adding more antennas will not result in the pointing errors averaging down. This is a limitation of out current pointing error model.
Contour maps with gray scale superimposed for the 8 m, 12 m, and 15 m mosaics have been reproduced for the 230, 345, 490, and 650 GHz simulations and are shown in Figures 6 through 11. These maps indicate that with 8 m antennas, pretty good mosaics can be made well into the submillimeter, probably better many have presumed. The appearance of the images simulated from the 12 m array are still qualitatively good, though not as clean as the 8 m array produces. Finally, the 15 m array produces images which are very poor, even for the 230 GHz case.
Experiments at high frequencies would typically be observed during the good atmospheric conditions, and experiments at lower frequencies would typically be observed during the poorer atmospheric conditions. We have estimated the typical atmospheric phase errors that an experiment at each frequency would face by using the time allocation algorithms in MMA Memo 174 (Holdaway, 1997b). We have applied model atmospheres, scaled to the severity of the supposed atmospheric conditions, to the mosaic simulations with pointing errors, adding phase errors to the visibilities which increase with baseline length in a manner consistent with our site testing interferometer data. No phase calibration is assumed, as the array crossing time is very short for these compact mosaicing arrays. The simulated mosaic data was processed as described above. We find that in all cases, the image quality for simulations with both pointing errors and appropriate phase errors is almost indistinguishable from the image quality for simulations with pointing errors alone. The details of the errors in the reconstructed image jump around a bit, but the statistical nature of the errors is basically unchanged.
References
Cornwell, 1988, ``Radio-interferometric imaging of very large objects'', A&A 143, 77.
Cornwell, Holdaway, and Uson, 1993, ``Radio-interferometric imaging of
very large objects: implications for array design'', A&A 271, 697-713.
Holdaway, M.A., 1992, MMA Memo 74, ``Surface Accuracy Requirements for
Mosaicing at Millimeter Wavelengths''.
Holdaway, M.A., Foster, S.M., Emerson, D.T., Cheng, J., and Schwab,
Fred, 1996, MMA Memo 159, ``Wind Velocities at the Chajnantor and Mauna
Kea Sites and the Effect on MMA Pointing.''
Holdaway, M.A., 1997a, MMA Memo 177, ``Sensitivity Comparisons of the
Various LSA/MMA Collaboration Options.''
Holdaway, M.A., 1997b, MMA Memo 174, ``How Many Fast Switching Cycles
Will the MMA Make in its Lifetime?''
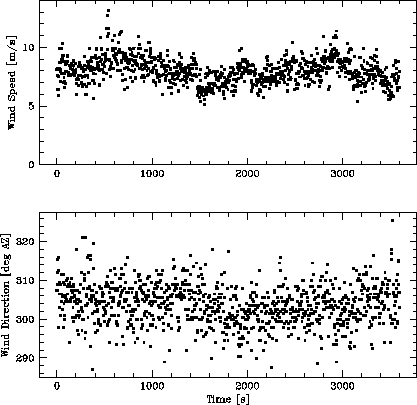
Figure 1: A typical time series for wind speed and direction. This time series has an average wind speed of about 8 m/s, the
day time median wind speed.
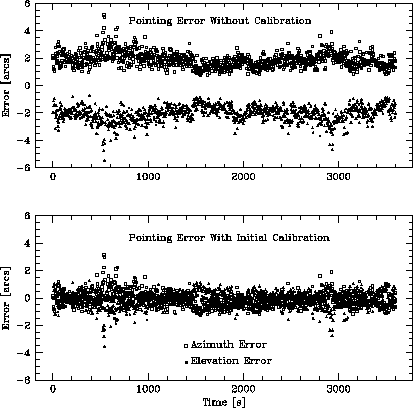
Figure 2: Pointing errors in Azimuth and Elevation infered from
the wind velocity time series in Figure 1: a) inferred pointing
errors without any pointing calibration have a
rms. b) if the an initial 60 s pointing calibration is
performed, the residual pointing errors are reduced to
rms.
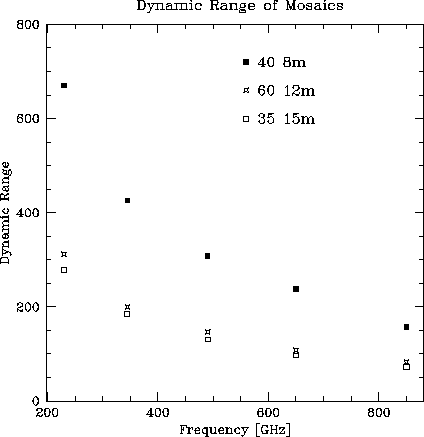
Figure 3: Dynamic range of simulated mosaic images as a function of
frequency for arrays of 40 8 m dishes with 1.1 arcsecond
pointing, 60 12 m dishes with 1.1 arcsecond pointing, 35 15 m
dishes with 1.5 arcsecond pointing.
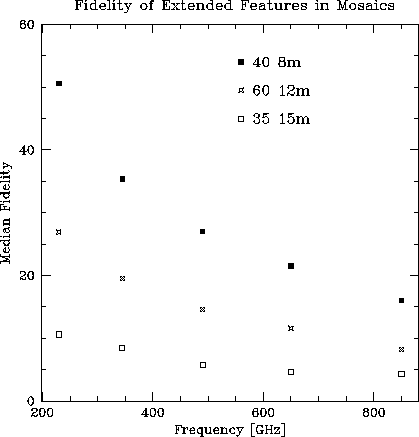
Figure 4: Median fidelity of simulated mosaic images as a function of
frequency for arrays of 40 8 m dishes with 1.1 arcsecond
pointing, 60 12 m dishes with 1.1 arcsecond pointing, 35 15 m
dishes with 1.5 arcsecond pointing. The median fidelity is a
measure of on-source errors and gives equal weight to all
on-source pixels; since our model image is dominated by weak,
extended emission, the median fidelity measures the array's
ability to image the extended emission.
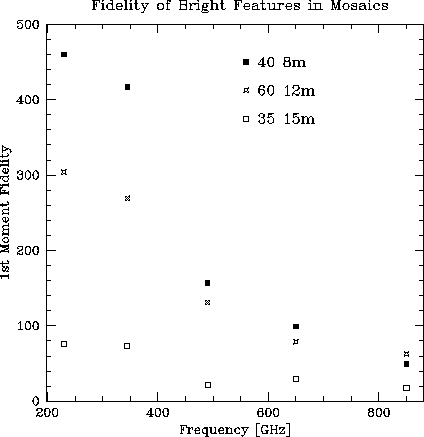
Figure 5: First moment fidelity of simulated mosaic images as a function of
frequency for arrays of 40 8 m dishes with 1.1 arcsecond
pointing, 60 12 m dishes with 1.1 arcsecond pointing, 35 15 m
dishes with 1.5 arcsecond pointing. The moment fidelity is a
measure of on-source errors which weights each pixel by its
flux, so it is a measure of the array's ability to image
bright, compact features upon an extended background.
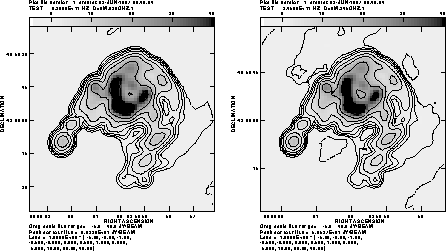
Figure 6: Mosaics from 40 8 m antennas, 230 and
345 GHz. Contour levels for all images are -5, -2, -1, -0.5,
-0.2, 0.2, 0.5, 1, 2, 5, 10, 20, 40 Jy/Beam, the gray scale range is from
-5 to 40 Jy/beam, and the peak flux of about 67 Jy/Beam.
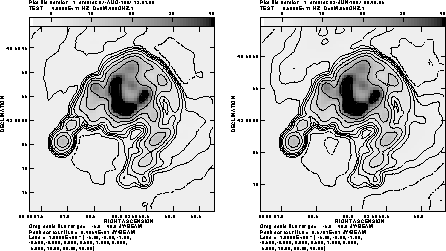
Figure 7: Mosaics from 40 8 m antennas, 490 and 650 GHz.
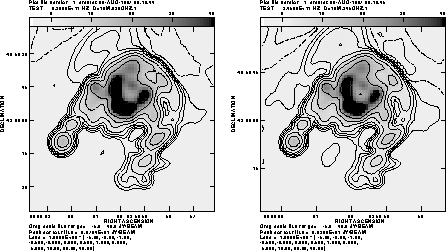
Figure 8: Mosaics from 60 12 m antennas, 230 and 345 GHz.
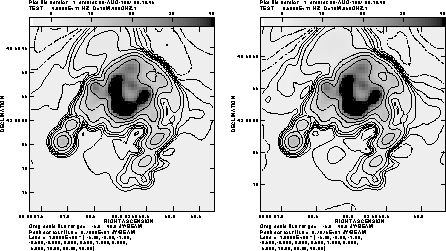
Figure 9: Mosaics from 60 12 m antennas, 490 and 650 GHz.
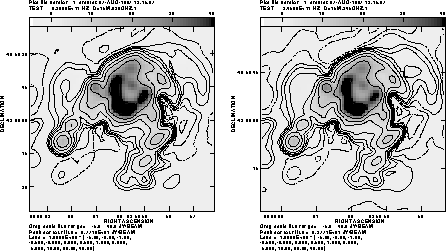
Figure 10: Mosaics from 35 15 m antennas, 230 and 345 GHz.
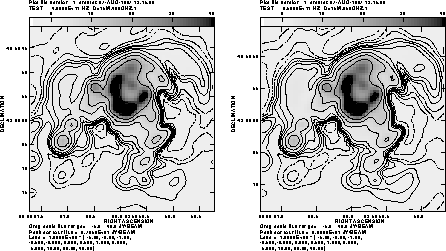
Figure 11: Mosaics from 35 15 m antennas, 490 and 650 GHz.