M.A. Holdaway, S.M. Foster, Darrel Emerson, Jingquan Cheng,
and Fred Schwab
National Radio Astronomy Observatory
email: (mholdawa, sfoster, demerson, jcheng, fschwab)@nrao.edu
August 9, 1996
We analyze wind statistics on the Mauna Kea/VLBA and Chajnantor, Chile sites for the one year period from May 1995 through April 1996 for the purposes of understanding the effects of the winds on pointing errors. Both the Chilean and the Mauna Kea sites display seasonal changes in the wind speed, with winds blowing strongest during the local winter. There is a very weak diurnal variation of wind speed on Mauna Kea, and a very strong diurnal variation of wind speed on the Chilean site with day time winds typically being 2-3 times higher than the night time winds. Since the opacity and phase stability on the Chilean site also settle down to their best values at night, high frequency observations and many of the most demanding mosaics will be performed at night. Median night time winds on the Chilean site are a benign 3.5 m/s, lower than the Mauna Kea night time median of 4.2 m/s.
From model distributions of observed AZ and EL and the pointing error calculations of Cheng (1996, in preparation), we calculate 9 m/s winds typically produce 3.5 arcsecond pointing errors in the conventional design antenna. Although Chilean winds are often high, they are often not highly variable over 10 minutes. The wind power spectrum in Chile is flatter than the Davenport spectrum (1962). If pointing is calibrated every 10 minutes, wind induced pointing errors are reduced to 0.25 - 0.5 of the static wind pointing error, bringing the conventional antenna close to meeting the pointing specification of 1 arcsecond or better in the best half of the wind conditions.
In contrast, the slant-axis mount with an on-axis paraboloid (Cheng, 1993) is able to point to 1.3 arcseconds in 9 m/s winds (Cheng, 1996). The MMA's 1 arcsecond pointing spec is extremely important for mosaicing at millimeter wavelengths and all observations in the submillimeter. We need to scrutinize antenna pointing and calibration in the future to ensure that the MMA antennas will be able to meet this pointing specification. If it is not believed that the conventional antenna can get close to the pointing spec, the slant-axis antenna must be reconsidered.
While the Chilean site has displayed spectacularly good opacity
( ![]() 3 times better than Mauna Kea) and phase stability (
3 times better than Mauna Kea) and phase stability ( ![]() 2
times better than Mauna Kea), the wind statistics have been
troublesome to the engineers. Winds are worst in the months with the
best opacities and phase stabilities, with medians as high as 9 m/s
for the winter months. High winds will affect the MMA antenna's
ability to point accurately. Originally, the MMA antennas were given
a pointing specification of 1 arcsecond rms to enable the MMA to make
high quality mosaic images (Cornwell, Holdaway, and Uson, 1994). It
was realized later that the 1 arcsecond pointing specification could
not be met in high winds, and the current specification is to point to
1 arcsecond rms in median winds (Napier et al., 1995). However,
now that the scope of the MMA project has grown to include frequencies
possibly as high as 850 GHz, the 1 arcsecond pointing specification is
even more crucial. Can the MMA antennas point to 1 arcsecond in
Chajnantor's high winds?
2
times better than Mauna Kea), the wind statistics have been
troublesome to the engineers. Winds are worst in the months with the
best opacities and phase stabilities, with medians as high as 9 m/s
for the winter months. High winds will affect the MMA antenna's
ability to point accurately. Originally, the MMA antennas were given
a pointing specification of 1 arcsecond rms to enable the MMA to make
high quality mosaic images (Cornwell, Holdaway, and Uson, 1994). It
was realized later that the 1 arcsecond pointing specification could
not be met in high winds, and the current specification is to point to
1 arcsecond rms in median winds (Napier et al., 1995). However,
now that the scope of the MMA project has grown to include frequencies
possibly as high as 850 GHz, the 1 arcsecond pointing specification is
even more crucial. Can the MMA antennas point to 1 arcsecond in
Chajnantor's high winds?
Mauna Kea is known for its calm winds, typically 5 m/s. Chajnantor has seen some very windy conditions, and the median wind speed of 9 m/s for July, 1995 is well known in MMA circles. We recorded the wind speed and direction about once every 10 minutes at the Chile and Mauna Kea/VLBA sites as part of our site testing campaign, and a careful look at the data for a one year period from May 1995 to April 1996 indicates that the Chilean site is not all that windy.
Figures 1 and 2 show the seasonal variations in the first, second, and third quartile wind velocities at the Mauna Kea/VLBA and the Chilean sites. Mauna Kea winds are higher for two months in the local winter, but the Chilean site has high winds for five months in the local winter. The overall median winds are 4.5 m/s for Mauna Kea and 6.0 m/s for Chile. Figure 3 illustrates the lack of diurnal variations in wind speed on Mauna Kea, and Figure 4 shows the strong diurnal effect on the Chilean site. The day time winds in Chile are quite high, but the median night time winds are about 3.5 m/s, which is lower than on Mauna Kea. This is significant, because both sites usually experience worse phase fluctuations and opacities during the day. The approximate peak to peak magnitudes of the diurnal effects of wind, phase stability, and opacity are summarized in Table 1. During the night when the best phase stabilities and opacities occur at Chile, the winds are also quite calm. We will still be able to observe during the day at the Chilean site, but very demanding observations which require good pointing such as high fidelity mosaicing at 230 GHz and 345 GHz, or which require both good pointing and good phase stability, such as 690 GHz and 850 GHz single pointing observations, will mostly take place at night. This situation will be completely analogous to the VLA: while the VLA observes 24 hours a day, the most demanding VLA observations are performed at night as well.
| Mauna Kea | Chile | |
| wind speed | 1.2 | 2.5 |
| rms phase | 6 | 3 |
| opacity | 3 | 1.2 |
While the median winds on the Chilean site are higher than on the Mauna Kea site, the peak winds are not so different on the two sites. The highest measured wind velocity on the Chilean site between 95 May and 96 April is 33 m/s (73 mph), while the highest measured wind velocity on the Mauna Kea/VLBA site was 28.8 m/s (64 mph). The 5000 m Chilean site typically has an atmospheric pressure of 550 mbar, while the 3750 m Mauna Kea site has an atmospheric pressure of 650 mbar. The destructive force of the wind is proportional to the air pressure times the wind velocity squared, so the highest wind on the Chilean site was about 20% more destructive than the highest wind in the Mauna Kea site. However, it should be noted that a statistic as volatile as maximum wind velocity should be sampled over several years. Hurricanes with much higher wind velocities occasionally strike Mauna Kea.
Jingquan Cheng (1996, in preparation) has calculated the static pointing error which the conventional and slant-axis MMA antennas would incur from a constant 9 m/s wind. The calculation results depend upon the orientation of the wind velocity vector with respect to the antenna azimuth and the antenna elevation, but we simplify the situation by averaging over azimuth and elevation, resulting in taking 3.5 arcseconds to be representative of these static pointing errors for the conventional antenna in a 9 m/s wind (see Appendix A for a justification of this number). The slant-axis design has pointing errors of about 1.3 arcseconds in a 9 m/s wind, though there are other contributions to the slant-axis pointing errors which have yet been quantified, such as slop in the big bearing and misalignment of the encoders. From this result, we assume that the slant-axis antenna will likely meet the MMA pointing specification. However, the slant-axis design is currently not in favor because of its poor close packing properties, whereas the conventional design will probably be able to have suitably small minimum antenna separations (Holdaway, 1996). Hence, we focus our analysis on the conventional design.
The deforming power of the wind is proportional to ![]() , and even
with zero wind velocity, the MMA antennas will have some residual
pointing error
, and even
with zero wind velocity, the MMA antennas will have some residual
pointing error ![]() , the native pointing of the antennas in
near perfect conditions. Assuming that the wind induced and zero
velocity pointing errors add quadratically and neglecting thermal
effects, the pointing error p as a function of velocity will be
something like
, the native pointing of the antennas in
near perfect conditions. Assuming that the wind induced and zero
velocity pointing errors add quadratically and neglecting thermal
effects, the pointing error p as a function of velocity will be
something like
![]()
Jingquan Cheng estimates ![]() is about 0.7 arcseconds. For the
median Chilean wind speed of 6 m/s, the pointing errors are
1.7 arcsecond, and for the median night time Chilean wind speed of
3.5 m/s, the pointing errors are 0.9 arcseconds. It appears that
during most night time conditions on Chajnantor, the pointing errors
will be limited by the native pointing
is about 0.7 arcseconds. For the
median Chilean wind speed of 6 m/s, the pointing errors are
1.7 arcsecond, and for the median night time Chilean wind speed of
3.5 m/s, the pointing errors are 0.9 arcseconds. It appears that
during most night time conditions on Chajnantor, the pointing errors
will be limited by the native pointing ![]() and not by
the wind. Submillimeter observations can be greatly helped if we can
find a way to inexpensively reduce
and not by
the wind. Submillimeter observations can be greatly helped if we can
find a way to inexpensively reduce ![]() .
.
While this is all quite encouraging, it may be possible to do even better since some of the static wind induced pointing errors will vary slowly and can be removed by frequent pointing calibration. The short time scale power spectrum of wind speed fluctuations is usually fairly steep. For frequencies above 0.01 Hz, the wind speed fluctuations are often modeled by the Davenport (1962) spectrum, which is a power law decreasing as frequency raised to the -1.67 power. Recent measurements of the wind spectrum at Green Bank obtained a spectrum with a power law very close to the Davenport spectrum. In late May 1996, we modified our site testing system in Chile to record the wind speed and direction every 3.5 s for a full hour every 3.5 hours. Figure 5 shows an example of the wind speed and direction over a one hour period. While some one hour profiles do show significant change in wind speed or direction, many show very constant wind direction and fairly constant wind speed. Our investigations indicate that the wind spectrum at Chajnantor is usually significantly flatter than the Davenport spectrum. Figure 6 shows the wind speed spectrum for one day with a fit power law exponent of -1.04. Typically, the power spectrum turns over below 0.005 - 0.01 Hz.
One result of the fast switching requirement on the antenna design is that the lowest resonant frequency must be pushed as high as possible. Modeling of the current design reveals a lowest resonant frequency of 6.7 Hz. Even with the flatter power spectrum, the wind has very little power at this high frequency. We assume that the antennas do not react to the wind resonantly, but rather the effects of the time dependent wind on the antenna can be approximated by a series of different static wind induced pointing errors. Under this approximation, we can use the wind time series to calculate the time series of wind induced pointing errors, and hence, the rms pointing errors which the MMA antennas would experience. (Jingquan Cheng is pursuing a proper dynamic analysis of the MMA antenna designs which should complement this memo. Inclusion of the dynamic wind calculation in the pointing error analysis is expected to increase the pointing error.) Since a large component of the wind velocity is constant on 10-30 minute time scales, it should be possible to calibrate the pointing on a nearby calibrator source every 10-30 minutes to remove the effects of the constant component of the wind velocity.
For the analysis and presentation of the residual pointing errors
after pointing calibration has been performed, we do not consider the
native pointing error ![]() which we introduced above. It
should remembered that such a term should be added in quadrature, so
that a wind induced pointing error of about 0.7 arcseconds will be
required to get a total pointing error of 1 arcsecond. We assume that
the pointing calibration can be achieved in just a few seconds, which
is quite reasonable as we shall see below. So, the rms static
pointing error will be
which we introduced above. It
should remembered that such a term should be added in quadrature, so
that a wind induced pointing error of about 0.7 arcseconds will be
required to get a total pointing error of 1 arcsecond. We assume that
the pointing calibration can be achieved in just a few seconds, which
is quite reasonable as we shall see below. So, the rms static
pointing error will be
while the residual pointing error after calibration will be
where the time t runs through the time interval between pointing
calibrations, and ![]() is the wind velocity at the start of
that time interval.
is the wind velocity at the start of
that time interval.
Optimally, we would like to be able to remove some of the power in the wind fluctuations from the antenna pointing. However, to do this requires pointing calibration more often than every 100 s since the power spectrum turnover is typically around 0.01 Hz. Instead, we will assume pointing calibration intervals which sound reasonable, such as 10, 20, and 30 minutes. However, since these calibration intervals are all beyond the spectral turnover, there is not a great deal of power in the long term fluctuations which they correct for, and they are more or less equally effective. However, there is usually a great deal of power in a constant wind velocity term, and even pointing calibration every 30 minutes will be effective at removing this constant component.
Figure 7 shows the cumulative distributions of rms day time pointing errors on Chajnantor for 1996 May 19 through July 10, as calculated from both the static wind pointing model in Equation 2 and from the pointing calibration model in Equation 3. The calibration interval was 10 minutes. Figure 8 shows the distributions of the rms night time static and calibrated pointing errors for the same time period. The period which we monitored has some of the windiest conditions of the year, yet post calibration median wind induced pointing is only about 1.5 arcseconds during the day and 0.5 arcseconds during the night. This is very encouraging, and indicates that the conventional antenna may meet the specification of 1 arcsecond pointing overall for the best 50% of the time. Again, note that the stiffer slant-axis antenna will have much better pointing than the conventional design. While we are not suggesting changing the design specification, sub-arcsecond pointing would greatly benefit submillimeter observations, even permitting mosaics at submillimeter wavelengths, so surpassing the pointing specification would positively impact the science which could be done with the MMA.
Before we assume that calibrating the mean effects of the wind on pointing can get the conventional design antenna close to the pointing specification, we need to determine if it is reasonable to perform pointing calibration every 10-30 minutes.
Frequent pointing calibration will not be a major fraction of
observing time. In fact, the antenna designers are already planning
to perform pointing calibration every 30 minutes or so to correct for
thermally induced pointing errors (Napier, 1995). We can perform
pointing calibration on the same quasars we plan to use for fast
switching phase calibration. The optimal frequency to use for
pointing will depend upon the details of the dependence of system
noise with frequency and the dependence of the flat spectrum quasar's
flux density with frequency. Holdaway, Owen, and Rupen (1994) found
that the flux of their sample of flat spectrum quasars decreased as
![]() between 8 and 90 Ghz. Since the beam size is inversely
proportional to frequency, if system noise increases more steeply
than
between 8 and 90 Ghz. Since the beam size is inversely
proportional to frequency, if system noise increases more steeply
than ![]() (which is likely if the receiver and atmospheric
noise dominates), pointing determinations are more sensitive at low
frequencies, and if system noise increases less steeply than
(which is likely if the receiver and atmospheric
noise dominates), pointing determinations are more sensitive at low
frequencies, and if system noise increases less steeply than
![]() (which is likely if ohmic losses and ground pickup
dominate), pointing is more sensitive at higher frequencies, at least
up to frequencies where the quasar fluxes begin to fall off more
rapidly. For the time being, we will assume that pointing will be
calibrated to 90 GHz. The 8 m MMA antennas will have a HPBW of about
100 arcseconds at 90 GHz, so 1 arcsecond pointing will be 1/100 of the
beam, which will be technically challenging. We must also know how to
transfer the 90 GHz pointing to higher frequency bands. At the VLA,
constant collimation offsets between the different observing bands are
assumed. However, since the MMA's situation is more demanding, we might
be forced to investigate elevation (or other) dependencies of the
collimation offsets between the various observing bands to accurately
transfer the 90 GHz pointing to higher frequency bands.
(which is likely if ohmic losses and ground pickup
dominate), pointing is more sensitive at higher frequencies, at least
up to frequencies where the quasar fluxes begin to fall off more
rapidly. For the time being, we will assume that pointing will be
calibrated to 90 GHz. The 8 m MMA antennas will have a HPBW of about
100 arcseconds at 90 GHz, so 1 arcsecond pointing will be 1/100 of the
beam, which will be technically challenging. We must also know how to
transfer the 90 GHz pointing to higher frequency bands. At the VLA,
constant collimation offsets between the different observing bands are
assumed. However, since the MMA's situation is more demanding, we might
be forced to investigate elevation (or other) dependencies of the
collimation offsets between the various observing bands to accurately
transfer the 90 GHz pointing to higher frequency bands.
Assuming the technical challenges of transferring the pointing
solution from the pointing band to the higher bands can be solved, we
next address how bright a source we need to solve for the pointing to
an accuracy of 1/100 of a beam. A simple analysis of the classical
five point pointing procedure performed interferometrically indicates
that the pointing error ![]() as a fraction of a beam
as a fraction of a beam
![]() is roughly
is roughly
![]()
where ![]() is the noise per visibility per point of the five
point, N is the number of antennas, and S is the source strength
at the beam center. Since the constant component of the wind will
have different effects on the antennas as they point in different
directions, we must point on quasars which are very close to the
target source. At this point, we don't know exactly how close, but
lets assume that 5 degrees distant on the sky is close enough. Foster
(1994) showed that Holdaway, Owen, and Rupen's (1994) 90 GHz source
counts predict that a quasar of 0.5 Jy or brighter is, on average,
about 5 degrees away from any target source. At 90 GHz, the noise per
visibility at full continuum bandwidth of 16 GHz (we will average both
polarizations) and
is the noise per visibility per point of the five
point, N is the number of antennas, and S is the source strength
at the beam center. Since the constant component of the wind will
have different effects on the antennas as they point in different
directions, we must point on quasars which are very close to the
target source. At this point, we don't know exactly how close, but
lets assume that 5 degrees distant on the sky is close enough. Foster
(1994) showed that Holdaway, Owen, and Rupen's (1994) 90 GHz source
counts predict that a quasar of 0.5 Jy or brighter is, on average,
about 5 degrees away from any target source. At 90 GHz, the noise per
visibility at full continuum bandwidth of 16 GHz (we will average both
polarizations) and ![]() of 30 K, leading to a noise per
visibility of 0.016 Jy in one second. So, integrating only 1 s for
each of the five points results in a formal error in the fractional
beam width of 0.007. The full five point, plus travel time, would
take on the order of 20 s. If such pointing were performed every 10 minutes,
the noise would be increased by about 2%.
of 30 K, leading to a noise per
visibility of 0.016 Jy in one second. So, integrating only 1 s for
each of the five points results in a formal error in the fractional
beam width of 0.007. The full five point, plus travel time, would
take on the order of 20 s. If such pointing were performed every 10 minutes,
the noise would be increased by about 2%.
When the wind velocity speed or direction display large fluctuations, there will be an additional noise-like error in the pointing solution due to the wind noise. However, when the wind is fluctuating enough for this to be a large problem, frequent pointing calibration will not work well anyway.
We still need to look critically at the pointing error calculations of Cheng when they are available, but it is clear that the MMA antennas do not need to meet the 1 arcsecond pointing specification for the deflections caused by a 9 m/s wind. It is likely that 1 arcsecond pointing can be achieved much of the time during the night when the wind velocities are much lower. Also, the wind velocities are often constant enough so that 1 arcsecond pointing could be achieved in higher velocity winds if pointing calibration were performed on time scales of 10 minutes on a quasar within 5 degrees of the target source. Such pointing calibration is feasible from a signal to noise point of view, and does not significantly add to the noise on the target source, but the precise tranfer of the pointing solution from 90 GHz to the higher frequencies may present technical challenges.
Since wind induced night time pointing errors scaled from Cheng's simulations will often be under half an arcsecond, the pointing will often be limited by the zero velocity pointing. Improving the pointing accuracy to better than 1 arcsecond will improve the 690 GHz and 850 GHz performance, even permitting moderate dynamic range mosaics. It is therefore important to design the MMA antennas with as low a zero wind velocity pointing error as we can reasonably afford.
Appendix
Jingquan Cheng (1996, in preparation) has performed static calculations of the bending of the conventional design antenna components due to wind loading in a 9 m/s wind using the Autocad package. However, the MMA antenna pointing errors induced by the wind will depend strongly on the elevation angle (EL) and the azimuth angle (AZ) with respect to the wind. Given the pointing error as a function of wind AZ and EL, the distribution of directions from which the wind blows, and the distribution of observed AZ and EL, we can estimate the typical pointing error which the conventional design antenna will suffer in a 9 m/s constant wind. The distribution of observed AZ and EL depends upon the distribution of sources on the sky and upon the observational strategy. While it is difficult to guess the use of a telescope a decade before it is built, two different source declination distributions and observing strategies, one for generic interferometry and one for mosaicing, give very similar average pointing errors.
We considered five different sorts of source distributions for the MMA:
For generic interferometry, we assume that we will be able to observe out to hour angles such that the air mass is 1.5 times greater than the transit air mass. For mosaicing observations, we assume that we will be able to observe only to hour angles of +/-2 before shadowing becomes a problem. The observing strategy does not have a strong effect on the resulting AZ-EL distribution.
We have simulated observations at declinations -88, -86, ... +58 (the effective range of the Chajnantor site), and the hour angle ranges which result from the above assumptions, with hour angle increments of 0.05, throwing out any observations below an elevation limit of 8 degrees. We have then binned each observed point in AZ and EL, weighting by the density of sources at that declination and inversely with the length of the tracks in hour angle. The resulting distribution of observed AZ and EL for the generic interferometry case is shown in Table 2, and the mosaicing case is shown in Table 3. We have also integrated through azimuth to obtain the distributions of observing elevation angle for these two cases (see Figure 11). Such curves will probably be useful for other unrelated calculations in the future.
Cheng's pointing errors included terms for both the yoke and the dish, but it was not possible to calculate these terms for all possible combinations of AZ and EL. Cheng calculated yoke pointing errors at 15 degree intervals in elevation and 30 degree intervals in azimuth, and dish pointing errors at 30 degree intervals in both elevation and azimuth. A few calculation results showed anomalously high values of the pointing error, and they were smoothed to avoid calculation error. Component pointing errors which could not be calculated were estimated by hand. The yoke and dish pointing errors were scalar added (admittedly a worst case). We further relied upon symmetry conditions to fill in the table. Linear 2pt interpolation was used to get pointing errors on a grid which was compatible with the distribution of observed AZ-EL. An example grid of the pointing errors is shown in Table 4. It should be stressed that the results of these calculations are somewhat uncertain, as they result from multiple vector components (even multiple components within the yoke and dish components) which may add or cancel. In addition, these pointing errors do not include the results of dynamic wind calculations, which would tend to increase the pointing errors.
Finally, we looked at the distribution of wind directions when the wind speed was greater than 6 m/s, shifting the pointing error function appropriately and integrating the pointing error over AZ EL weighting by the observing distribution, then integrating over the wind direction distribution. The wind direction distribution is peaked at about AZ=280 deg with a spread of about 45 deg. This procedure assumes that the distribution of observing AZ EL and the wind direction distribution are independent. The generic interferometry case resulted in a pointing error of about 3.4 arcseconds, and the mosaicing case resulted in a pointing error of about 3.5 arcseconds. The mosaic case has a larger pointing error because the small hour angle range results in more observing at higher elevations, and the conventional design antenna pointing errors are larger at high elevations.
References
Cheng, Jingquan, 1993, ``Slant-Axis Antenna Design II'', MMA Memo 101.
Cheng, Jingquan, 1996, MMA Memo on antenna pointing, in preparation.
Cornwell, T.J., Holdaway, M.A., and Uson, Juan, 1994,
``Radio-interferometric Imaging of Very Large Objects: Array Design'',
A&A 271, 693-713.
Davenport, A.G., 1962, ``Buffeting of a Suspension Bridge by Storm Winds'',
ASCE Journal of Structural Division, 88 (ST2) 233-68.
Foster, S.M., 1994, ``Angular Distance to MMA Calibrators Based on
90 GHz Source Counts'', MMA Memo 124.
Holdaway, M.A., Owen, F.N. and Rupen, M.P., 1994, ``Source Counts at 90 GHz'',
MMA Memo 123.
Holdaway, M.A., 1996, ``Evaluating the Minimum Baseline Constraints for
the MMA D Array'', MMA Memo 155.
Napier, P.J., et al., 1995, ``Antennas for the
Millimeter Wave Array: The MDC Antennas Working Group'', MMA Memo 145.
EL 5. 15. 25. 35. 45. 55. 65. 75. 85.
AZ 10. 0.720 2.082 1.524 1.256 1.221 0.912 0.629 0.424 0.153
30. 0.000 0.564 1.326 1.321 1.162 0.905 0.652 0.391 0.154
50. 0.000 0.000 0.228 1.221 1.113 0.893 0.630 0.415 0.131
70. 0.000 0.000 0.000 0.355 1.054 0.907 0.647 0.424 0.160
90. 0.000 0.000 0.000 0.000 1.080 0.979 0.775 0.465 0.153
110. 0.000 0.000 0.000 0.000 1.493 1.422 1.203 0.937 0.146
130. 0.000 0.000 0.000 0.353 1.301 1.027 0.685 0.445 0.410
150. 0.000 0.000 0.145 1.913 2.057 1.281 0.780 0.428 0.229
170. 0.000 0.010 0.463 1.324 1.770 1.759 0.853 0.435 0.250
190. 0.000 0.010 0.461 1.337 1.758 1.760 0.833 0.446 0.249
210. 0.000 0.000 0.132 1.890 2.056 1.290 0.770 0.408 0.287
230. 0.000 0.000 0.000 0.333 1.281 1.027 0.685 0.455 0.353
250. 0.000 0.000 0.000 0.000 1.471 1.423 1.183 0.947 0.158
270. 0.000 0.000 0.000 0.000 1.021 0.978 0.775 0.477 0.140
290. 0.000 0.000 0.000 0.309 1.111 0.872 0.682 0.412 0.160
310. 0.000 0.000 0.205 1.198 1.078 0.870 0.642 0.415 0.155
330. 0.000 0.544 1.306 1.328 1.186 0.882 0.675 0.402 0.142
350. 0.721 2.084 1.495 1.236 1.231 0.889 0.641 0.401 0.140
EL 5. 15. 25. 35. 45. 55. 65. 75. 85.
AZ 10. 0.641 1.940 1.611 1.422 1.594 1.230 0.909 0.647 0.273
30. 0.000 0.115 0.549 1.139 1.494 1.185 0.923 0.573 0.238
50. 0.000 0.000 0.000 0.000 0.316 1.038 0.919 0.586 0.243
70. 0.000 0.000 0.000 0.000 0.000 0.265 0.985 0.692 0.236
90. 0.000 0.000 0.000 0.000 0.000 0.000 0.995 0.768 0.248
110. 0.000 0.000 0.000 0.000 0.000 0.000 1.616 1.532 0.238
130. 0.000 0.000 0.000 0.000 0.000 0.167 1.245 0.824 0.607
150. 0.000 0.000 0.000 0.000 0.346 2.053 1.457 0.757 0.493
170. 0.000 0.000 0.045 2.007 5.994 4.030 1.658 0.753 0.312
190. 0.000 0.000 0.046 2.042 6.139 4.175 1.760 0.842 0.464
210. 0.000 0.000 0.000 0.000 0.346 2.053 1.457 0.757 0.493
230. 0.000 0.000 0.000 0.000 0.000 0.167 1.245 0.824 0.607
250. 0.000 0.000 0.000 0.000 0.000 0.000 1.616 1.532 0.238
270. 0.000 0.000 0.000 0.000 0.000 0.000 0.995 0.768 0.248
290. 0.000 0.000 0.000 0.000 0.000 0.265 0.985 0.692 0.236
310. 0.000 0.000 0.000 0.000 0.316 1.038 0.919 0.586 0.243
330. 0.000 0.115 0.549 1.139 1.494 1.185 0.923 0.573 0.238
350. 0.661 1.903 1.562 1.368 1.520 1.155 0.830 0.564 0.179
EL 7 22 37 52 67 82
AZ 0 2.27 2.43 2.82 2.85 3.28 4.28
30 3.08 2.88 2.86 3.28 3.85 4.22
60 3.97 3.54 3.88 4.13 3.65 2.99
90 3.10 3.25 3.00 3.10 3.08 3.11
120 3.22 3.42 3.38 3.48 3.62 3.27
150 2.64 2.86 2.82 3.19 3.87 4.38
180 2.14 2.65 2.83 3.19 3.84 4.38
210 2.64 2.86 2.82 3.19 3.87 4.38
240 3.22 3.42 3.38 3.48 3.62 3.27
270 3.10 3.25 3.00 3.10 3.08 3.11
300 3.97 3.54 3.88 4.13 3.65 2.99
330 3.08 2.88 2.86 3.28 3.85 4.22
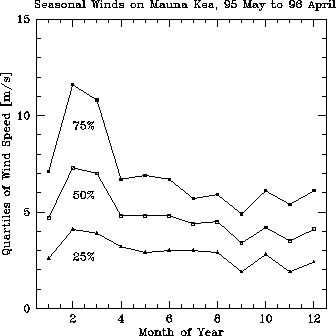
Figure 1: First, second, and third quartile wind speeds on Mauna Kea as
a function of month of year.
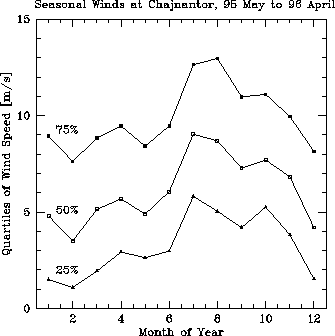
Figure 2: First, second, and third quartile wind speeds in Chile as
a function of month of year.
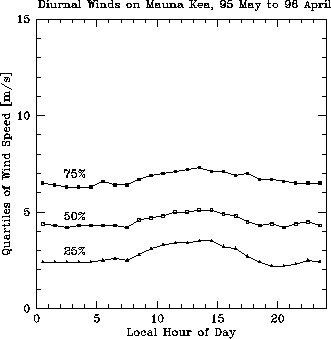
Figure3: First, second, and third quartile wind speeds on Mauna Kea as
a function of local hour of day.
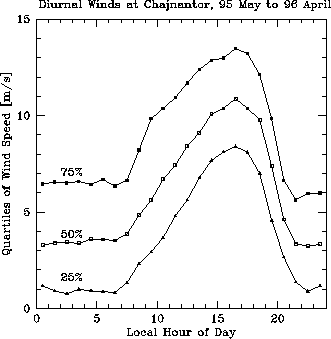
Figure 4: First, second, and third quartile wind speeds in Chile as
a function of local hour of day.
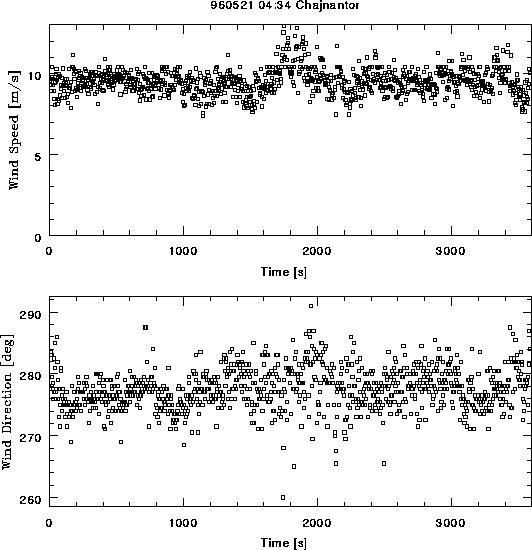
Figure 5: Example of the wind speed and direction on Chajnantor for May 21, 1996,
3:34-4:34 UT (around midnight local time).
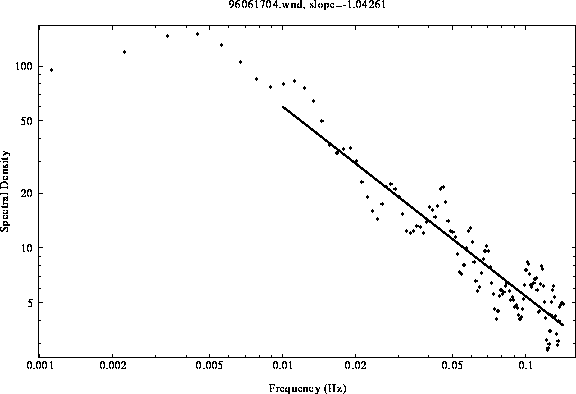
Figure 6: Power spectrum of wind speed on Chajnantor for June 17, 1996.
The fit power law slope is -1.04, much flatter than the Davenport
spectrum of -1.67.
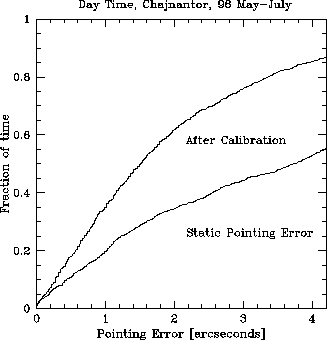
Figure 7: Cumulative distributions of Chajnantor day time rms pointing errors
before and after calibration for part of the 1996 winter season.
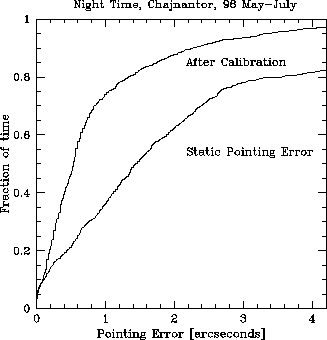
Figure 8: Cumulative distributions of Chajnantor night time rms pointing errors
before and after calibration for part of the 1996 winter season.
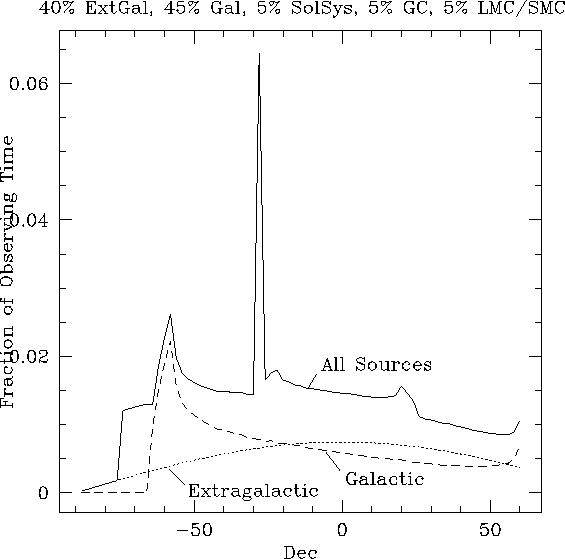
Figure 9: Assumed distribution of sources for generic interferometry.
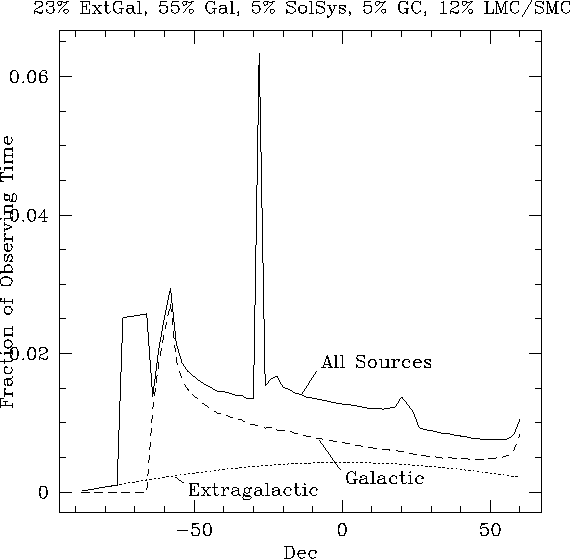
Figure 10: Assumed distribution of sources for mosaic observations.
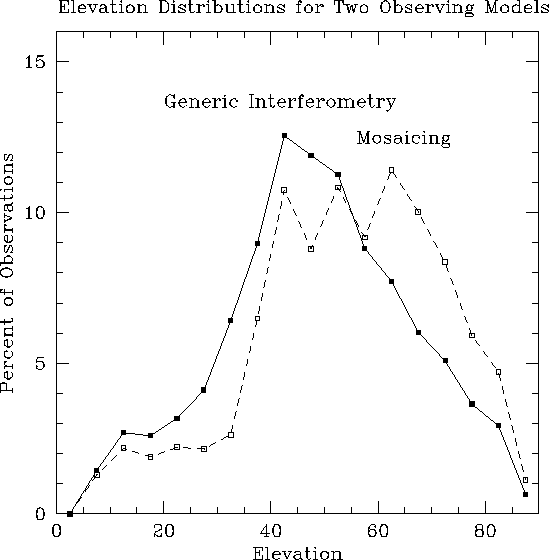
Figure 11: Distribution of observing elevation for the generic interferometry,
1.5 airmass case and the mosaicing, 2 hour case.